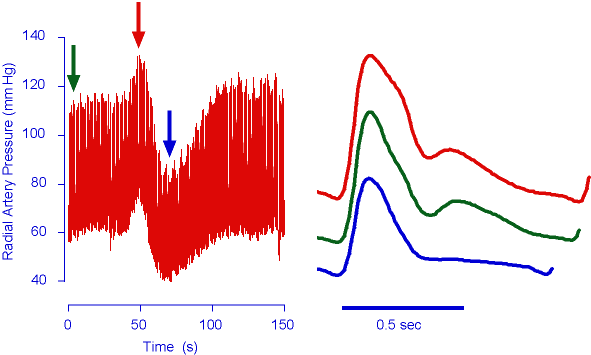

The effect of adrenaline (5 mcg i.v.) on the arterial pressure waveform.
The left hand panel shows the blood pressure response. There is an initial rise, due to vasoconstriction, followed by a marked fall resulting from vasodilatation without an adequate compensatory increase in cardiac output. This fall in blood pressure is considerably greater than that seen in the last figure.
The right hand panel shows three representative arterial pressure waveforms expanded from the trace on the left at the times corresponding to the coloured arrows. The green waveform is control, the red waveform is at the peak pressure and the blue waveform is at the trough.
When the heart ejects blood it creates a wave that travel through the arteries and is reflected from the periphery. Comparing the red waveform with the blue, you can see that when the pressure is high (due to vasoconstriction) there is increased wave reflection which causes the downstroke to bulge to the right and the pressure at the dicrotic notch to be higher relative to the end-diastolic pressure. The area under the systolic portion of the red waveform (during vasoconstriction) is therefore greater than that under the systolic portion of the blue waveform, although the stroke volume is reduced by the vasoconstriction. The often quoted statement that stroke volume is proportional to the area under the systolic portion of the arterial waveform is clearly wrong!