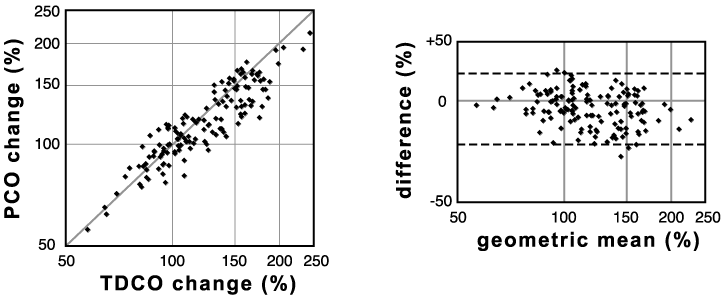

PCO is intended to follow changes in cardiac output, after calibration with another method. Therefore, ‘PCO change’ was plotted against ‘TDCO change’, where ‘change’ refers to the cardiac output expressed as a percentage of the first cardiac output determination. Thus, PCO/PCOstart was plotted against TDCO/TDCOstart. There were 152 determinations in 9 patients. Least squares regression gave y = 0.77x (r2 = 0.81). The limits of agreement for Bland-Altman analysis were from -26% to +21%. For more detailed discussion of importance of plotting changes rather than absolute values see statistics.