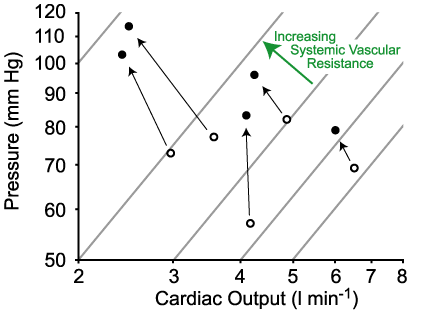

The effect of phenylephrine, as assessed by pulse contour analysis (PCO). Mean arterial pressure and cardiac output are plotted on logarithmic axes, so contours of constane systemic vascular resistance are straight (diagonal) lines. Open circles indicate values prior to injection of phenylephrine (0.25 or 0.5 mg bolus). Closed circles represent the values at the first peak in mean arterial pressure.