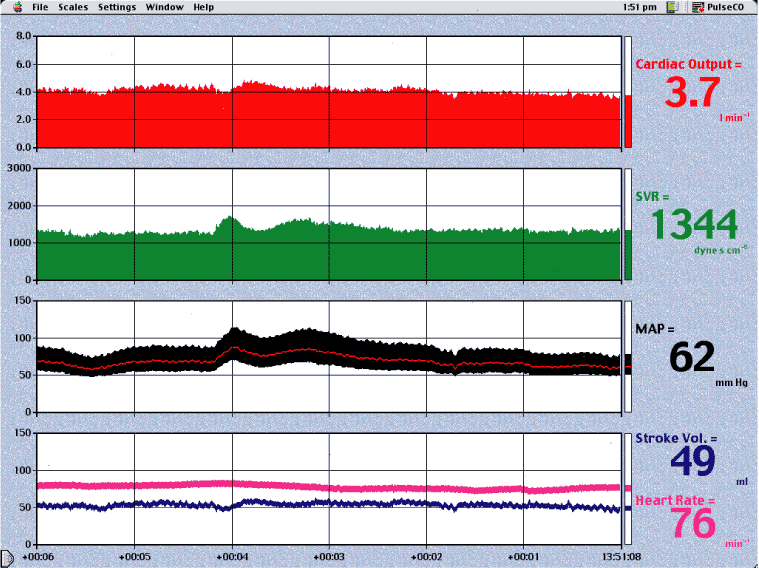

An example of the response to phenylephrine (0.5 mg bolus intravenous injection). The display shows cardiac output (CO), systemic vascular resistance (SVR), mean arterial pressure (MAP), and stroke volume and heart rate. The total display time is 6 minutes. There is an initial increase in SVR followed by a decline towards the control value and then a slower second increase, presumably due to recirculation of the phenylephrine. The increase in SVR caues a small fall in stroke volume and cardiac output. For a further example of the response to phenylephrine please click here.