
Pacing explanation
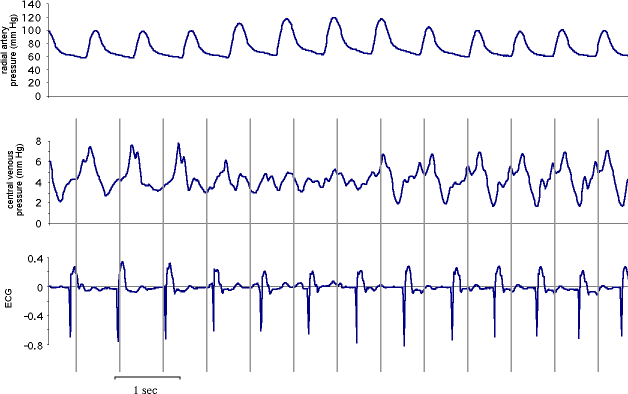
This figure shows radial arterial pressure (top panel), central venous pressure (middle panel) and ECG (bottom panel) recorded in the patient showing masquerading SPV.
The faint vertical lines have been drawn to coincide with the starts of the P waves of the ECG. When the P waves are timed so that atrial contraction boosts ventricular filling (as in the middle third of this recording), arterial pressure is higher. At the beginning and end of the recording the atrium is contracting against a closed triscupid valve, with the result that canon waves are seen in the central venous trace and there is no boost to ventricular filling, so arterial pressure is lower.