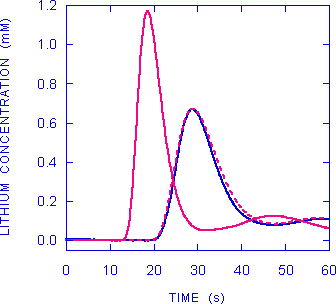

Results from one patient. Lithium chloride was injected at time = 0 into the left atrium (this produced the dilution curve shown by the continuous red line) or the right atrium (this produced the curve shown by the continuous blue line). The data points obtained following left atrial injection were entered into an Excel spreadsheet, passed through 2 sequential filters, a delay added and replotted as the interrupted red line. Results from all the patients can be seen in the next figure.