Introduction
The use of extracorporeal membrane oxygenation (ECMO) in adults for the
treatment of life-threatening gas exchange failure is becoming increasingly
successful, although the indications for its use remain controversial. Venovenous
ECMO is the usual method used unless cardiac support is needed and has several
advantages over venoarterial ECMO in adults and children. One of the problems
associated with this circuit is that some of the oxygenated blood pumped
to the patient may return directly to the ECMO circuit rather than passing
through the pulmonary and systemic circulation. Increasing the ECMO flow
in order to improve systemic saturation may result in an increase in this
shunt fraction which is also affected by cannula position and design. A
further problem is that of measuring cardiac output in these patients. Conventional
bolus thermodilution cannot be used since some of the indicator may be lost
into the ECMO circuit with consequent overestimation of cardiac output.
We have previously described a method of measuring shunt fraction and cardiac
output during venovenous ECMO and evaluated it in an in
vitro model. In the present study we describe the clinical adaptation
of this method and its use in a patient.
Method
The patient was a 16 year old boy (weight 44kg, height 1.6m) who developed
septicaemia secondary to septic arthritis of his knee. There was progressive
failure of gas exchange over the next week and in spite of treatment with
venovenous ECMO he died 24 hours later. A Baxter Vigilance Cardiac Output
Monitor (Baxter Edwards Critical-Care, Irvine, CA) and a pulmonary artery
catheter incorporating a heating element were being used to provide continuous
thermodilution cardiac output (CTDCO) measurement. The heating element was
in the right ventricle so loss of indicator (heat) into the ECMO circuit
should not have occurred unless there was tricuspid regurgitation.
A diagram of the venovenous ECMO circuit is shown in the figure:

Blood was withdrawn through a modified 17 Fr 'arterial/venous' cannula
(DLP Inc., Grand Rapids, MI) inserted into the right atrium via the right
internal jugular vein. This blood was pumped by a centrifugal pump (Bio-Medicus
540 console with BP80 pump head, Medtronic, Eden Prairie, MN) through a
membrane oxygenator (Maxima Plus PRF Carmeda Bonded Hollow Fibre Oxygenator,
Medtronic) to the patient via a 17 Fr 'arterial' cannula (DLP Inc.) inserted
into the inferior vena cava via the right femoral vein. Flow in the ECMO
circuit was measured with a TX40 Bioprobe flow transducer (Medtronic), which
has a specified accuracy of ± 5%.
Two lithium sensors were used: the arterial sensor was connected via a 3-way
tap and short connector to a 20g cannula in the left radial artery and the
ECMO sensor was connected to the tubing between the ECMO pump and the membrane
oxygenator.
Measurement of flows
Cardiac output and shunt fraction were measured by lithium dilution
at three ECMO flows. The flow in the ECMO circuit is always known whereas
the cardiac output and shunt flows are not. Since flow = dose/area, if two
of these quantities are known the third can be derived. The primary area
under the lithium dilution curve recorded by the ECMO sensor was measured
and therefore the dose of lithium which passed in the shunt flow to generate
that curve was derived. Division of this shunted dose by the injected dose
gave the shunt fraction; subtraction of the shunted dose from the injected
dose gave the dose which generated the curve recorded by the arterial sensor
allowing cardiac output to be calculated. To make the measurements, 0.3
mmol lithium chloride was injected via a port attached to the tubing between
the oxygenator and the femoral venous catheter (see Figure above) while
blood was sampled at 4 ml/min through the sensors. In addition CTDCO was
recorded at each ECMO flow.
Results

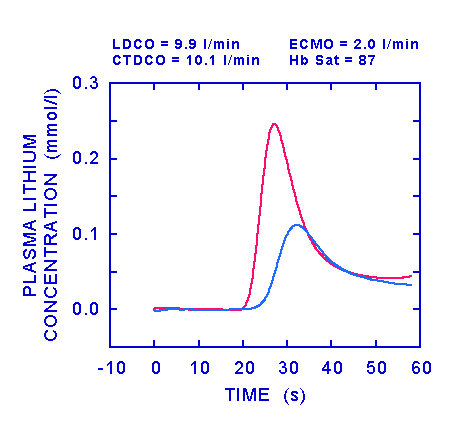
In the figure above, the ECMO flow was 2 l/min, CTDCO was 10.1 l/min and lithium dilution cardiac output (LDCO) was 9.9 l/min. The red line shows the lithium dilution curve recorded in radial arterial blood and the blue line shows the recording from the sensor in the ECMO circuit. None of the lithium appeared in the ECMO circuit before it had reached the arterial blood, showing that there was no shunt at this ECMO flow. The area of the primary curve recorded from the arterial sensor was 2.47 mM.s and (since there was no shunt) the dose which generated this curve was the same as the injected dose (0.3 mmol). Dividing this dose by the primary area and correcting for the haemoglobin concentration (9.0 g/dl) gave a cardiac output of 9.9 l/min.

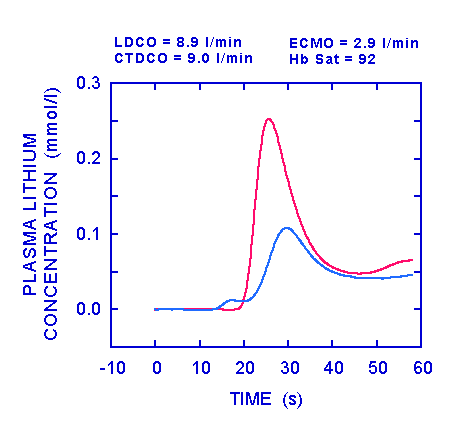
The figure above shows the situation after increasing the ECMO flow to 2.9 l/min. This has resulted in a significant increase in haemoglobin saturation from 87 to 92%. LDCO and CTDCO were similar at 8.9 and 9.0 l/min respectively. A small hump, representing a very small shunt, can be seen on the trace (blue line) from the sensor in the ECMO circuit prior to the appearance of the lithium at the arterial sensor. Cardiac output was derived in the same way as for the first set of curves, assuming the shunt to be negligible.

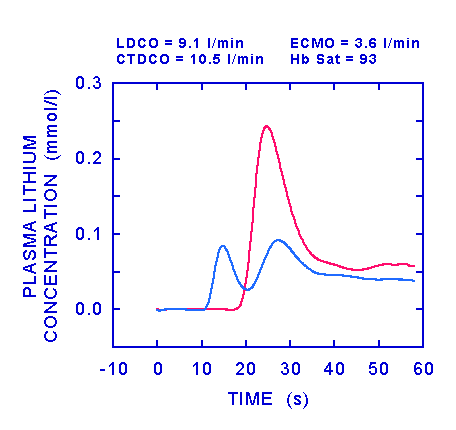
In the figure above, the ECMO flow has been increased further to 3.6 l/min. This has resulted in an insignificant increase in haemoglobin saturation from 92 to 93%. The trace (blue line) from the ECMO sensor showed two peaks: the first occurred before the arterial peak and so represents shunt, the second peak occurred after the peak in the arterial blood and was caused by this blood reaching the right atrium and passing into the ECMO circuit. The integral of the lognormal fitted to the first peak recorded by the ECMO sensor was 0.46 mM.s. Since the ECMO flow was 3.6 l/min, the dose which generated this initial peak was
dose (mmol) = [flow (l/min) x area (mM.s ) x [1-PCV]] ÷ 60
if packed cell volume is calculated as haemoglobin concentration divided
by 34,
dose = [3.6 x 0.46 x [1 - 9/34]] ÷ 60 = 0.02 mmol
Subtraction of this dose from the injected dose gave the dose which generated
the curve recorded from the arterial sensor. The primary area of this curve
was 2.5 mM.s and cardiac output was calculated as
cardiac output = [0.3 - 0.02] ÷ 2.5 ÷ [1 - 9/34] x 60 = 9.1
l/min
The dose of lithium which produced the first peak of the lithium concentration
curve recorded from the ECMO sensor ( 0.02 mmol) was 7% of the injected
dose. This figure of 7% represented the shunt fraction ( = shunted dose/injected
dose). Shunt flow = shunt fraction x ECMO flow, so by increasing the ECMO
flow by 700 ml/min (from 2.9 to 3.6 l/min) shunt flow increased by 250 ml/min.
The CTDCO value of 10.5 l/min was probably an overestimate since there was
no change in heart rate or blood pressures.
.
Discussion
This technique allows cardiac output and shunt flow to be measured quickly and safely. These patients already have central venous and arterial catheters in place and so no further catheterisation is needed. It would of course be possible to measure cardiac output by injecting the lithium via a pulmonary artery catheter in which case all the lithium would pass through to the systemic circulation, but this would expose the patient to the risks of pulmonary artery catheterisation and would not provide measurement of shunt fraction. The dose of lithium is very small and has no known pharmacological effect. The method provides a very sensitive indicator of shunt since the shunted dose of lithium is diluted in the relatively small ECMO flow and therefore gives a large dilution curve; a 'double hump' on the ECMO sensor trace immediately alerts the perfusionist to the presence of shunt flow.
Measurement of cardiac output allows better support of the cardiovascular
system by manipulation of filling pressure, heart rate, systemic vascular
resistance as well as by administration of inotropic drugs. Measurement
of shunt enables the perfusionist to set the most appropriate ECMO flow;
it may also be useful for ensuring optimal positioning of the venous cannulae
and in improving their design.
Acknowledgement
We are grateful to the Editor of Perfusion for permission to reproduce information from: Linton, R.A.F., Turtle, M., Band, D.M., O'Brien, T.K., Jonas, M.M. and Linton, N.W.F. A new technique of measuring cardiac output and shunt fraction during venovenous extracorporeal membrane oxygenation. Perfusion 1999; 14: 43-48.